Master TrendFusion Ultimate™ Pro: The Professional Trader's Guide
Introduction
In the world of professional trading, the difference between consistent profitability and mediocrity often comes down to the quality of your analytical tools. While retail traders juggle multiple indicators trying to make sense of conflicting signals, institutional traders rely on sophisticated systems that integrate multiple technical components into unified, actionable intelligence.
The TrendFusion Ultimate™ Pro Indicator brings institutional-grade trend detection technology to serious individual traders. This isn't a rehashed moving average crossover system with a fancy name-it's a professionally engineered fusion of Moving Averages, Directional Movement Index (DMI), and Average Directional Index (ADX) that has demonstrated exceptional performance across both cryptocurrency and traditional markets.
With backtested returns of 31,355,829.65% on Bitcoin and 19,918,872.01% on Ethereum, along with impressive performance on high-growth stocks like NVIDIA (+469,397.50%) and Apple (+1,154,990.03%), TrendFusion Ultimate™ Pro represents a significant advancement in systematic trend-following technology. But exceptional historical performance is just the beginning-what sets this indicator apart is its comprehensive suite of professional features designed for traders who demand the absolute best.
What Makes TrendFusion Ultimate™ Pro Different
Professional trading tools are distinguished not by marketing claims, but by their technical sophistication, optimization depth, and analytical transparency. TrendFusion Ultimate™ Pro delivers across all three dimensions.
Institutional-Grade Multi-Layered Signal Confirmation
The indicator employs a proprietary three-component confirmation system that dramatically reduces false signals while maintaining sensitivity to genuine trend changes. Unlike single-indicator systems that generate noise in ranging markets, TrendFusion Ultimate™ Pro requires simultaneous agreement from its Moving Average, DMI, and ADX components before signaling entry or exit.
This multi-layered approach creates a filtering mechanism that separates high-probability trend movements from market noise. When all three components align, you're not seeing a potential opportunity-you're seeing a statistically validated trend with institutional-grade confirmation.
Expanded Market Coverage with Professional Optimization
The Pro version includes 10 professionally optimized presets covering major cryptocurrencies and high-growth technology stocks. Each preset represents hundreds of hours of backtesting and optimization work, fine-tuned to the specific volatility characteristics and trend behaviors of individual markets:
Cryptocurrency Presets:
Bitcoin (BTCUSD): 31,355,829.65% return, 2.46 profit factor
Ethereum (ETHUSD): 19,918,872.01% return, 1.91 profit factor
Ripple (XRPUSD): 15,988,900.86% return
Cardano (ADAUSD): 127,021.31% return
Technology Stock Presets:
Apple (AAPL): 1,154,990.03% return
MicroStrategy (MSTR): 917,064.43% return
NVIDIA (NVDA): 469,397.50% return
Netflix (NFLX): 72,371.44% return
Tesla (TSLA): Optimized for high-volatility tech trading
NASDAQ-100 (QQQ): Index-level optimization
These aren't generic parameter sets applied across different markets. Each preset uses unique combinations of moving average types, DMI periods, ADX smoothing, and trend level thresholds specifically calibrated for optimal performance on that particular instrument.
Advanced Moving Average Arsenal
Where basic systems offer 2-3 moving average options, TrendFusion Ultimate™ Pro provides 15 professionally implemented moving average types, each with distinct characteristics suited to different market conditions and trading styles:
Classic Moving Averages:
SMA (Simple Moving Average): Reliable, smooth trend identification
EMA (Exponential Moving Average): Faster response to recent price action
WMA (Weighted Moving Average): Balanced responsiveness
Low-Lag Advanced Types:
ZLEMA (Zero Lag EMA): Minimal lag for early trend detection
DEMA (Double EMA): Reduced lag with smoothness
TEMA (Triple EMA): Further lag reduction
HullMA: Exceptional smoothness with low lag
ALMA (Arnaud Legoux MA): Gaussian distribution-based smoothing
Specialized Types:
LineReg (Linear Regression): Statistical projection-based trending
Tilson T3: Advanced smoothing algorithm
BWMA (Butterworth MA): Signal processing-based filtering
RMA (Running MA): Momentum-aware averaging
SSMA (Smoothed SMA): Enhanced noise reduction
VARMA (Variable MA): Adaptive period adjustment
TriangularMA: Double-smoothed trending
This extensive selection allows you to fine-tune the indicator's responsiveness to match your specific market conditions, trading timeframe, and risk tolerance. Fast-moving markets benefit from low-lag types like ZLEMA or HullMA, while more volatile conditions often perform better with smoothed types like SSMA or TriangularMA.
Understanding the Core Mechanism
Professional traders don't use black-box systems-they demand transparency and understanding. Here's exactly how TrendFusion Ultimate™ Pro generates its signals.
The Three-Component Confirmation System
Component 1: Adaptive Moving Average (Trend Direction)
The moving average component serves as the system's primary trend detector, identifying the overall direction of price movement. Unlike fixed-parameter systems, you can select from 15 different moving average calculations, each with unique lag and smoothing characteristics.
The moving average doesn't just show trend direction-it acts as the first confirmation filter. Price action above a rising moving average suggests bullish trend conditions, while price below a falling moving average indicates bearish momentum. But the system never acts on this signal alone.
Component 2: DMI (Directional Movement Index) - Momentum Confirmation
The DMI component measures the strength and direction of price movement, providing crucial momentum confirmation that separates genuine trends from false breakouts. It consists of two directional indicators:
DMI+ measures upward directional movement strength. When DMI+ exceeds DMI-, bullish momentum is building. DMI- measures downward directional movement strength. When DMI- exceeds DMI+, bearish momentum dominates.
The crossover of these components provides momentum confirmation, but again, the system waits for additional validation before signaling.
Component 3: ADX (Average Directional Index) - Trend Strength Filter
This is where TrendFusion Ultimate™ Pro's sophistication truly shines. The ADX component measures trend strength regardless of direction, acting as a critical filter that prevents trading in choppy, ranging markets where trend-following systems typically underperform.
When ADX reads below the threshold (typically 15-25 depending on the preset), the market is consolidating and signals are suppressed. When ADX rises above the threshold, trend strength is confirmed and the system becomes active. This filtering mechanism is responsible for the indicator's exceptional profit factors and reduced drawdowns.
Signal Generation Logic
Long Entry Requirements (All Must Be True):
ADX > Trend Level Threshold (confirming trending market conditions)
DMI+ > DMI- (confirming upward momentum dominance)
Moving Average is rising (confirming upward trend direction)
Short Entry Requirements (All Must Be True):
ADX > Trend Level Threshold (confirming trending market conditions)
DMI- > DMI+ (confirming downward momentum dominance)
Moving Average is falling (confirming downward trend direction)
Exit Signal Trigger:
The system exits when any of the entry conditions fails, not waiting for a complete reversal. This approach captures the bulk of trend movements while avoiding the common mistake of holding through reversals.
Exceptional Backtested Performance Across Markets
Historical performance testing provides crucial insights into a system's edge and behavior across different market conditions. TrendFusion Ultimate™ Pro has undergone rigorous backtesting across multiple asset classes and market cycles.
Bitcoin (BTCUSD) - Flagship Cryptocurrency Performance
Testing Period: August 18, 2011 to October 15, 2025 (14+ years)
Net Profit: 31,355,829.65% ($10,000 → $3,135,592,964.68)
Average Monthly Profit: 184,530.76%
Average Yearly Profit: 2,214,369.06%
Win Rate: 46.15%
Profit Factor: 2.46
Maximum Drawdown: 32.84%
Recovery Factor: 954,907.01
Total Trades: 195
Average Trade Time: 10.22 days
Average Winning Trade: 26.51%
Average Losing Trade: -2.99%
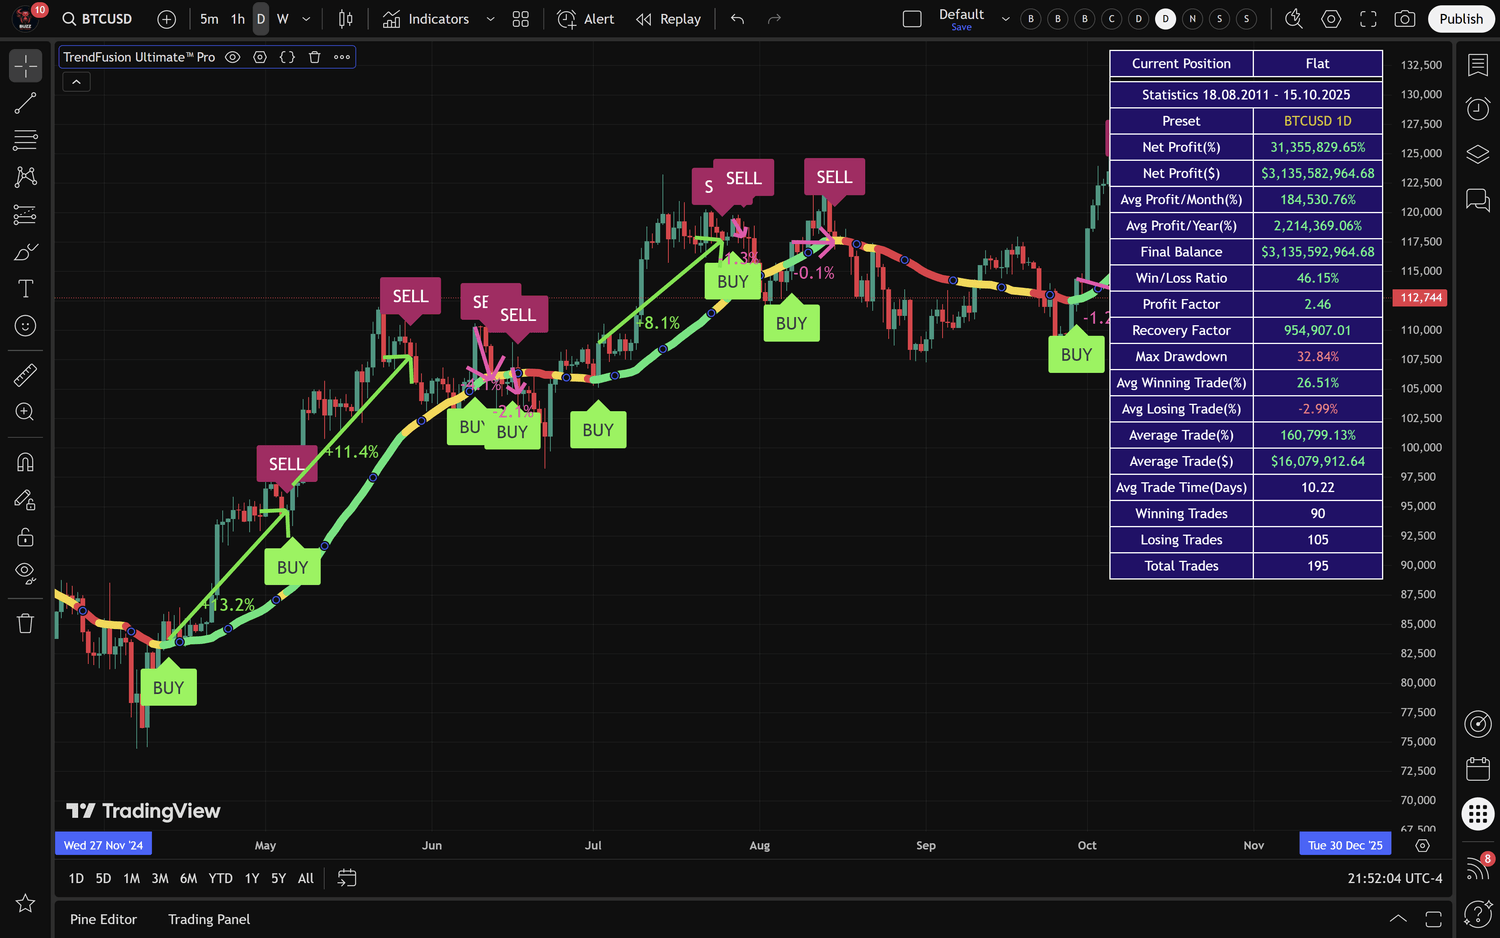
Figure 1. TrendFusion Ultimate™ Pro in action on Bitcoin (BTCUSD) daily chart, showing buy/sell signals with profit percentages and comprehensive statistics panel displaying 31,355,829.65% net profit over 14+ years of backtesting.
The Bitcoin preset demonstrates the power of systematic trend-following during an unprecedented bull market. The sub-50% win rate combined with a 2.46 profit factor illustrates the critical principle of letting winners run-average winning trades capture 26.51% gains while average losses are contained to 2.99%.
Ethereum (ETHUSD) - Smart Contract Platform Leader
Testing Period: August 7, 2015 to October 15, 2025 (10+ years)
Net Profit: 19,918,872.01% ($10,000 → $1,991,897,201.35)
Average Monthly Profit: 162,891.1%
Average Yearly Profit: 1,954,693.18%
Win Rate: 42.75%
Profit Factor: 1.91
Maximum Drawdown: 36.85%
Recovery Factor: 540,595.76
Total Trades: 131
Average Trade Time: 12.22 days
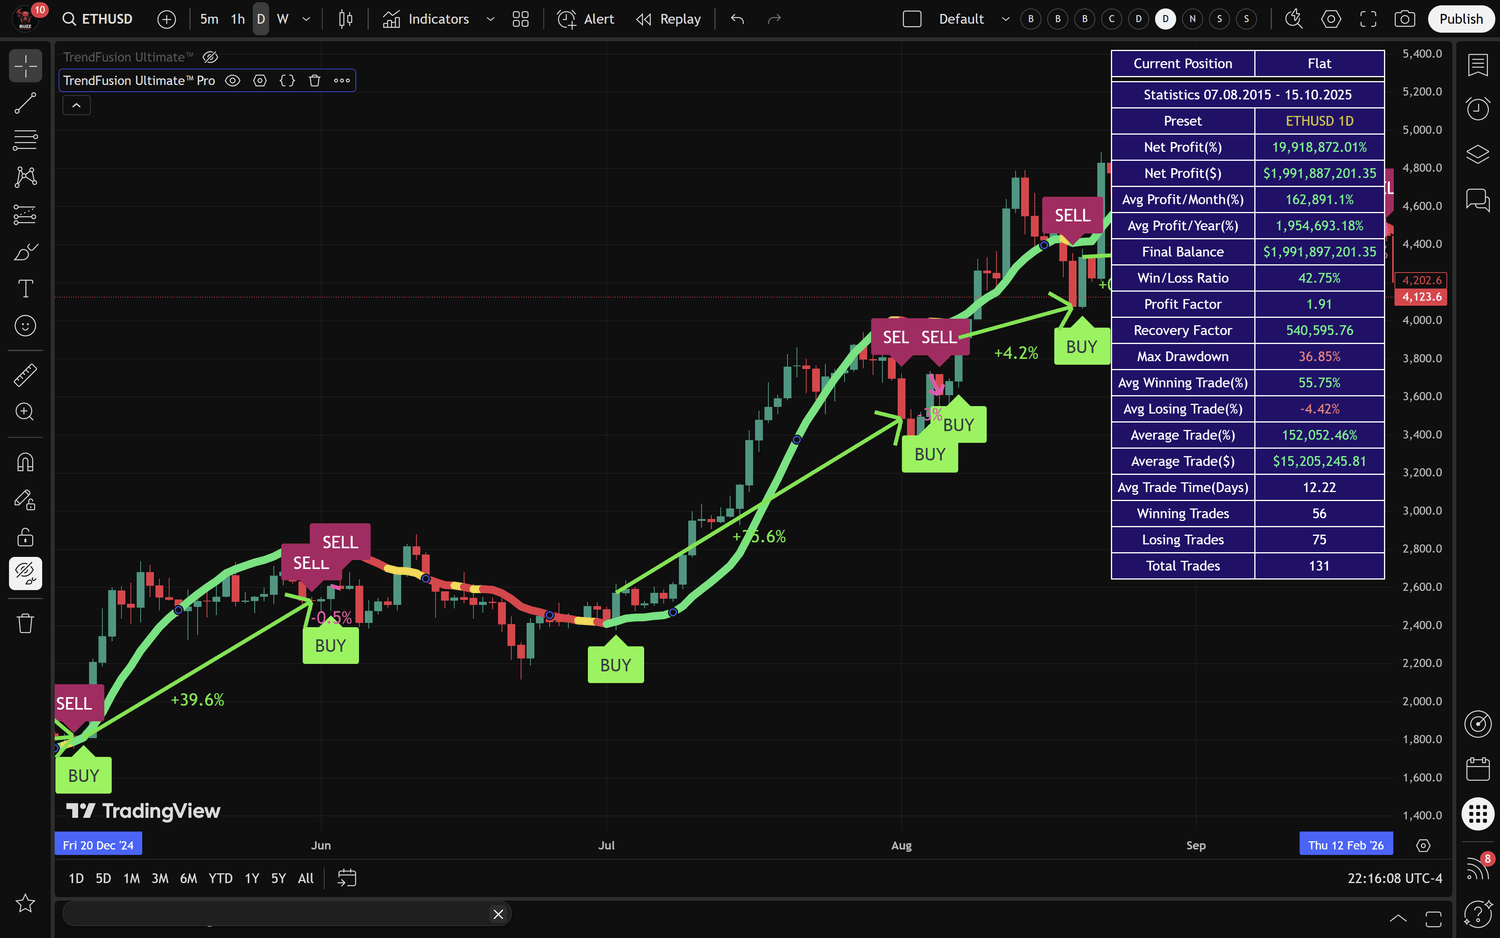
Figure 2. TrendFusion Ultimate™ Pro performance on Ethereum (ETHUSD) daily chart, demonstrating 19,918,872.01% return with clear visual signals and detailed performance metrics including 42.75% win rate and 1.91 profit factor.
Ethereum's results showcase performance across a shorter but equally volatile testing period. The 1.91 profit factor and exceptional recovery factor demonstrate the system's ability to generate substantial returns even with a win rate below 43%.
XRP (XRPUSD) - Alt-Coin Volatility Champion
Net Profit: 15,988,900.86%
Performance Highlights: Exceptional capture of XRP's explosive rally periods
The XRP preset demonstrates TrendFusion Ultimate™ Pro's effectiveness in highly volatile alt-coin markets, where traditional indicators often generate excessive false signals.
Technology Stocks - Traditional Market Validation
Apple (AAPL): 1,154,990.03% return
MicroStrategy (MSTR): 917,064.43% return
NVIDIA (NVDA): 469,397.50% return
Netflix (NFLX): 72,371.44% return
The technology stock presets prove that the system's effectiveness extends beyond cryptocurrency markets. These results validate the underlying methodology across traditional equity markets with different regulatory structures, trading hours, and participant profiles.
Understanding the Performance Metrics
Professional traders analyze multiple performance dimensions beyond simple returns:
Profit Factor: This critical metric divides gross profits by gross losses. A profit factor above 1.5 is considered excellent for systematic strategies. TrendFusion Ultimate™ Pro's Bitcoin preset achieves 2.46, indicating that for every dollar lost, the system generates $2.46 in profits.
Recovery Factor: This metric divides net profit by maximum drawdown, showing how efficiently the system converts risk into reward. Bitcoin's recovery factor of 954,907.01 is exceptional, demonstrating that returns vastly exceed the maximum risk exposure.
Maximum Drawdown: The largest peak-to-trough decline during the testing period. Bitcoin's 32.84% maximum drawdown is remarkably controlled given the 31+ million percent return, highlighting the system's risk management effectiveness.
Win Rate vs. Win/Loss Ratio: Notice that win rates hover around 42-46%, yet the systems are highly profitable. This reflects the fundamental principle of asymmetric risk/reward-average winners are 8-10 times larger than average losers, creating substantial profitability despite modest win rates.
Professional Features and Customization
TrendFusion Ultimate™ Pro includes comprehensive professional features that separate it from retail-grade indicators.
17 Comprehensive Performance Statistics
The indicator's statistics panel displays real-time performance analytics directly on your chart, providing complete transparency into system performance:
Core Performance Metrics:
Net Profit (%): Total percentage return
Net Profit ($): Absolute dollar return based on initial capital
Average Monthly Profit (%): Annualized monthly performance
Average Yearly Profit (%): Annualized returns
Final Balance: Ending account value
Risk and Efficiency Metrics:
Win/Loss Ratio: Percentage of profitable trades
Profit Factor: Gross profit divided by gross loss
Recovery Factor: Net profit divided by maximum drawdown
Maximum Drawdown: Largest peak-to-trough decline
Trade Analysis Statistics (Pro Exclusive):
Winning Trades: Count of profitable trades
Losing Trades: Count of unprofitable trades
Average Winning Trade (%): Mean winning trade percentage
Average Losing Trade (%): Mean losing trade percentage
Average Trade Time (Days): Mean trade duration
Total Trades: Complete trade count
Average Trade (%): Overall mean trade performance
Average Trade ($): Dollar-weighted average trade
These statistics update in real-time as you adjust parameters or switch presets, providing immediate feedback on how modifications affect system performance.
11 Professional Visual Themes
Professional traders spend hours analyzing charts, making visual comfort and clarity essential. TrendFusion Ultimate™ Pro includes 11 carefully designed color themes optimized for different preferences and lighting conditions:
Blue Classic: Traditional professional blue theme with high contrast
Black Diamond: Sleek dark theme with accent colors
Navy Ocean: Deep blue professional aesthetic
Purple Classic: Sophisticated purple tones
Purple Neon: High-contrast neon purple for dark environments
Orange Fire: Warm tones for extended screen time
Emerald Green: Easy on eyes for all-day trading
Neon Pink: High visibility theme
Ice Blue: Cool tones for minimal eye strain
Gold Rush: Warm gold accents on dark background
Black & White: Maximum clarity and simplicity
Each theme maintains consistent visual hierarchy while allowing traders to personalize their analytical environment.
Enhanced Visual Signals
TrendFusion Ultimate™ Pro includes professional-grade visual elements that make trade execution clear and unambiguous:
Profit Percentage Labels: Each buy and sell signal displays the profit percentage achieved on that specific trade, providing immediate visual feedback on system performance.
Color-Coded Signals: Lime green labels for long entries, bright green "BUY" markers, and vibrant red/pink "SELL" markers ensure signals are immediately visible even on busy charts.
Profit Lines: Visual connections between entry and exit points show profit/loss for each trade at a glance, with color coding indicating profitability.
Trend-Colored Moving Average: The moving average line changes color based on trend conditions-lime green for bullish trends, red for bearish trends, and yellow for neutral conditions when ADX is below the threshold.
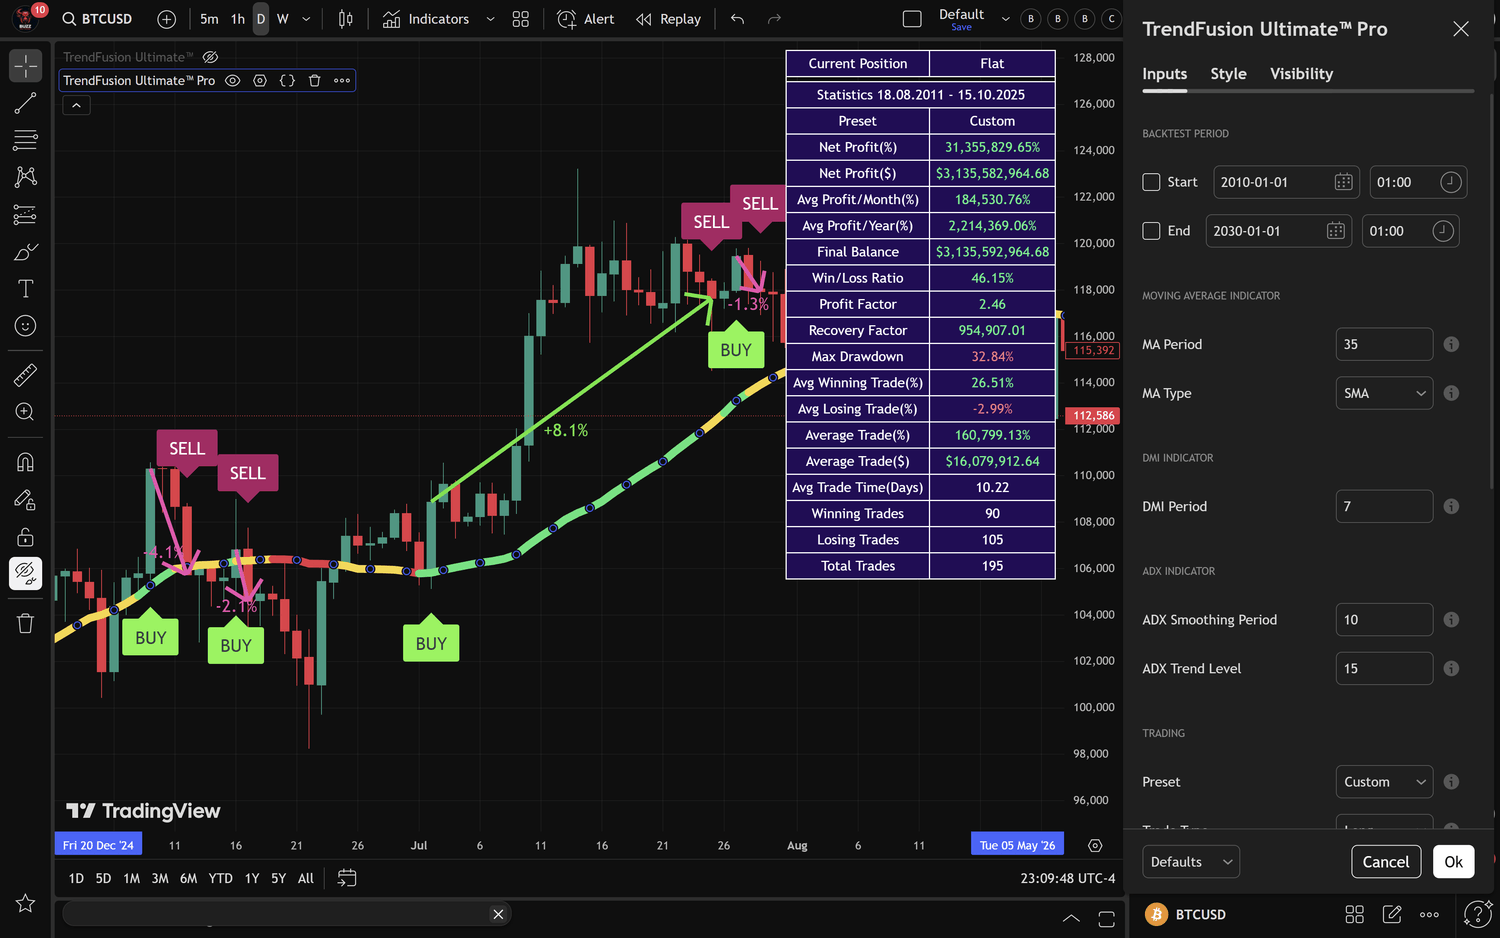
Figure 3. TrendFusion Ultimate™ Pro configuration panel showing preset selection, moving average options, DMI settings, ADX parameters, and trade type selection with comprehensive parameter tooltips.
Strategic Implementation Guide
Possessing a professional tool is different from using it professionally. Here's how to implement TrendFusion Ultimate™ Pro for optimal results.
Initial Setup and Configuration
Step 1: Load the Indicator
Add TrendFusion Ultimate™ Pro to your TradingView chart. The indicator will default to the Custom preset, allowing you to explore all available parameters.
Step 2: Select Your Market Preset
Choose the preset that matches your target market:
For Bitcoin trading: Select "BTCUSD 1D (Bitstamp)"
For Ethereum: Select "ETHUSD 1D (Bitstamp)"
For NVIDIA: Select "NVDA 1D (Nasdaq)"
And so forth for other supported markets
When you select a specific preset, all parameters automatically adjust to their optimized values. These settings represent the culmination of extensive backtesting and should be your starting point.
Step 3: Configure Your Timeframe
All presets are optimized for the daily (1D) timeframe. While you can use TrendFusion Ultimate™ Pro on other timeframes, expect to adjust parameters for optimal performance. The daily timeframe provides the best balance of signal quality and trade frequency for trend-following systems.
Step 4: Set Your Trade Type
The Trade Type parameter determines which signals the system generates:
Long: Only generates buy signals and exits (recommended for crypto markets with long-term upward bias)
Short: Only generates sell/short signals and exits (for bear markets or inverse instruments)
LongAndShort: Generates both buy and sell signals (for experienced traders comfortable with both directions)
Most traders begin with "Long" only, particularly in cryptocurrency markets that have demonstrated long-term appreciation. The "LongAndShort" option is powerful but requires proper risk management and experience with short positions.
Step 5: Customize Visual Preferences
Select your preferred color theme from the 11 available options. Adjust the statistics table position and size to fit your screen layout. Toggle visual elements (signals, profit lines, statistics table) based on your analytical preferences.
Position Sizing and Risk Management
Even the most profitable system will fail without proper risk management. Professional implementation requires disciplined position sizing:
The 1-5% Rule: Never risk more than 1-5% of your total account on a single trade. Given TrendFusion Ultimate™ Pro's maximum drawdowns of 30-36%, position sizing is crucial for long-term survival and success.
Example Position Sizing:
$100,000 account with 2% risk per trade = $2,000 maximum risk per position. If you're trading Bitcoin with an 8% stop loss (based on recent volatility), your position size would be $2,000 ÷ 0.08 = $25,000 position or approximately 0.25 BTC at $100,000 per BTC.
Account Reserve: Consider maintaining 20-30% of your account in cash reserves for drawdown periods. This prevents forced liquidations during inevitable losing streaks.
Scaling Strategies: Professional traders often scale into and out of positions. Consider entering 50% of your planned position on the initial signal, adding the remaining 50% if the trade moves favorably.
Signal Interpretation and Execution
Entry Signals:
When you see a lime green "BUY" label appear on your chart with the moving average line turning green, all three confirmation components have aligned for a long entry. For short trades (when enabled), red "SELL" labels indicate short entry opportunities.
The signal appears after the bar closes, meaning you would execute the trade on the opening of the next bar. Some traders prefer to set limit orders slightly above (for longs) or below (for shorts) the signal bar's close to ensure execution.
Exit Signals:
Red "SELL" labels indicate long position exits. The system exits when any of the entry conditions fails-ADX drops below threshold, DMI reverses, or the moving average changes direction. This approach captures most of the trend while avoiding the common mistake of holding through complete reversals.
Managing Open Positions:
Once in a position, resist the urge to override the system based on news, opinions, or fear. The system has been specifically designed to manage positions through the inevitable volatility of trending markets. Trust the process or don't use the system.
Advanced Parameter Optimization
While the presets work excellently out of the box, experienced traders may want to optimize parameters for specific market conditions or personal preferences. To modify parameters, first select "Custom" from the Preset dropdown, then adjust individual settings.
Moving Average Period (1-200+):
Lower values (20-35) provide faster response to trend changes but generate more false signals. Higher values (50-100) are more reliable but slower to react. The default preset values represent optimal backtested settings.
Moving Average Type Selection:
For fast-moving markets with strong trends: ZLEMA, DEMA, HullMA
For volatile, choppy markets: SMA, SSMA, TriangularMA
For balanced performance: EMA, LineReg, ALMA
DMI Period (1-50):
Controls momentum sensitivity. Lower values (5-10) increase responsiveness to price changes. Higher values (14-20) provide smoother, more reliable momentum readings. Most presets use 6-14 for optimal balance.
ADX Smoothing (1-50):
Determines how quickly the trend strength indicator responds to market changes. Lower values make ADX more reactive; higher values create smoother, slower-moving readings. Typical range: 10-25.
ADX Trend Level (10-50):
Your critical filter threshold. Higher values (25-30) mean fewer but higher-quality signals. Lower values (15-20) generate more signals but may include weaker trends. This is often the first parameter to adjust when customizing.
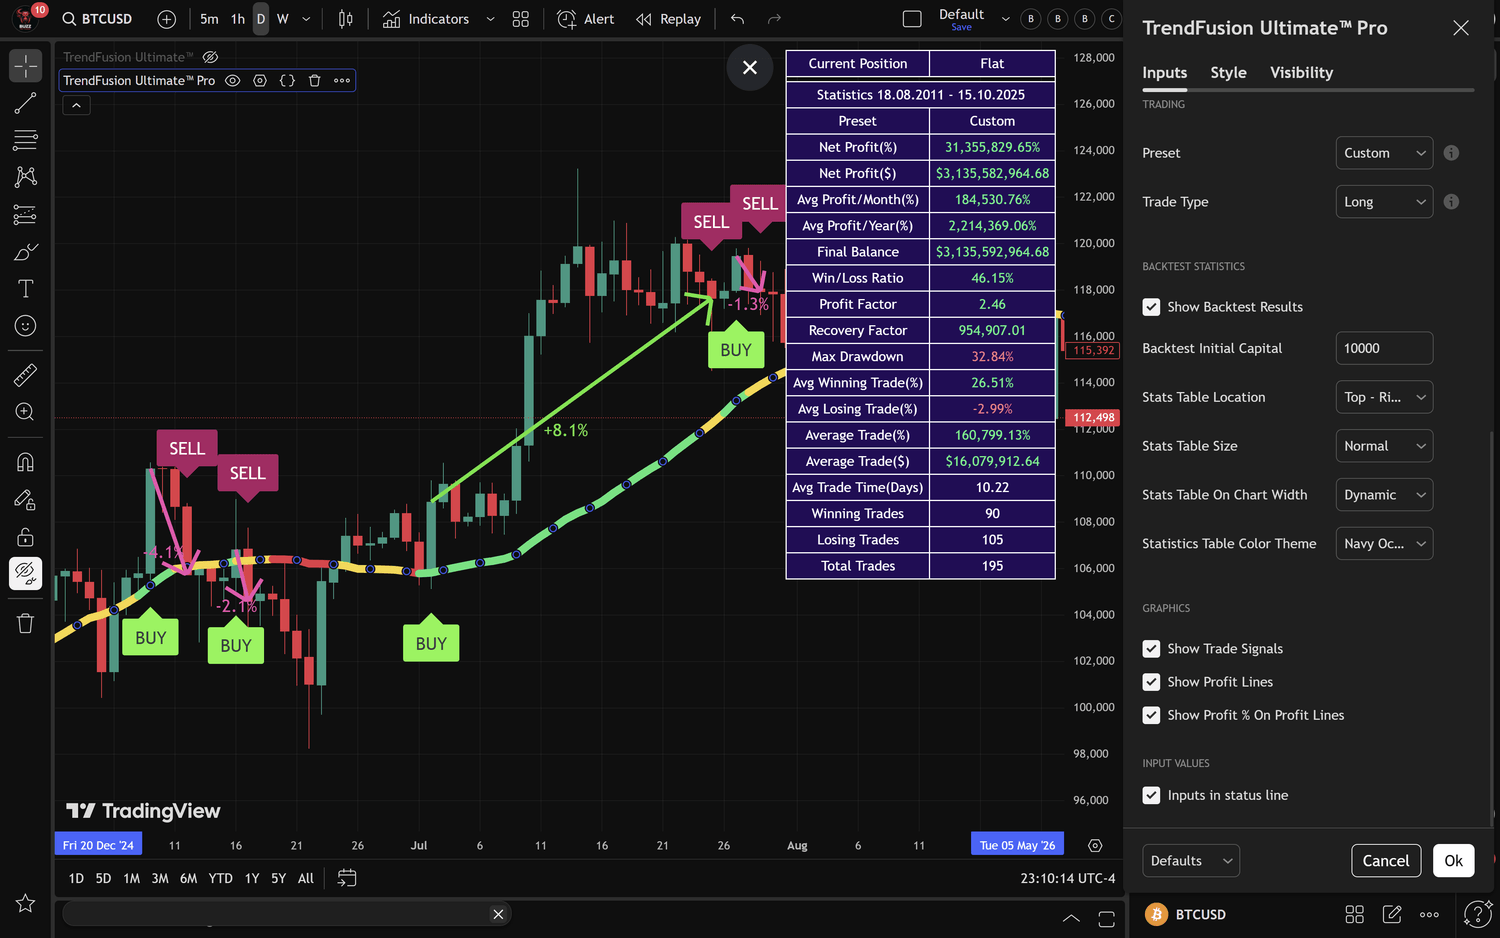
Figure 4. Real-time statistics panel displaying all 17 performance metrics, including the Pro-exclusive trade analysis statistics like Recovery Factor, Average Trade Time, Winning/Losing Trades breakdown, and detailed profit/loss percentages. Trading, Backtest and Graphics Parameters are shown in the configuration panel.
Professional Trading Strategies and Best Practices
Professional implementation extends beyond parameter settings to encompass broader strategic considerations.
Cryptocurrency Trading Strategies
Multi-Asset Portfolio Approach:
Rather than concentrating on a single cryptocurrency, consider using TrendFusion Ultimate™ Pro across multiple crypto assets simultaneously. The Bitcoin, Ethereum, XRP, and Cardano presets allow you to diversify while maintaining systematic consistency.
Example allocation: 40% BTC, 30% ETH, 20% XRP, 10% ADA, each traded using their respective optimized presets.
Timeframe Consistency:
Stick to the daily timeframe where presets are optimized. Cryptocurrency markets trade 24/7, making daily bars more reliable than hourly or 4-hour periods that can show artificial patterns based on traditional market hours.
Exchange Selection:
The presets reference specific exchanges (Bitstamp for BTC/ETH, Kraken for ADA) because historical data varies between exchanges. For optimal results matching backtest performance, use the same exchanges referenced in preset names.
Bear Market Adaptations:
During extended bear markets, consider reducing position sizes by 30-50% or switching to "LongAndShort" mode to capitalize on downward trends. The long-only approach works exceptionally well during bull cycles but may underperform in sustained downtrends.
Technology Stock Trading Strategies
Respect Market Hours and Sessions:
Unlike 24/7 crypto markets, stocks trade during specific hours. The daily close occurs at 4:00 PM ET. Ensure your trading plan accounts for after-hours gaps and pre-market movements that can affect entry execution.
Earnings Season Considerations:
Major earnings announcements can create gap moves that impact system performance. Consider reducing position sizes by 20-30% during earnings week or exiting positions before earnings if you're risk-averse. Alternatively, maintain full positions to capture earnings-driven trend extensions.
Sector Rotation Awareness:
Technology stocks often move in concert based on sector rotation. When TrendFusion Ultimate™ Pro generates signals on multiple tech stocks simultaneously, it's confirming a broader sector trend-potentially a higher-confidence setup.
Leverage and Options:
The technology stock presets can serve as signal generators for options strategies. Buying call options on long signals or put options on short signals (when enabled) can amplify returns, though they also increase risk substantially.
General Professional Guidelines
Backtesting Custom Modifications:
Before implementing any parameter changes in live trading, backtest your modifications thoroughly. TradingView's strategy tester allows you to validate changes across extended historical periods. A minimum of 50 trades and 3 years of data should be analyzed before deployment.
Paper Trading Transition:
Even with extensive backtesting, begin with paper trading (virtual money) for at least 20 trades or one month before deploying real capital. This validates your execution procedures and builds confidence in the system.
Trade Journaling:
Maintain detailed records of every trade including: entry date, entry price, exit date, exit price, profit/loss percentage, profit/loss dollars, market conditions, and any deviations from the system. This documentation is invaluable for continuous improvement.
System Discipline:
The most common cause of system failure is user override. If you're taking signals but exiting based on fear, news, or other indicators, you're not following the system-you're gambling. Either trust TrendFusion Ultimate™ Pro completely or don't use it at all.
Realistic Expectations:
The exceptional backtested returns on Bitcoin and cryptocurrency occurred during unique historical circumstances. While the system demonstrates clear edge, expect more moderate returns in traditional markets (20-100% annually) and understand that future cryptocurrency returns may differ from historical performance.
Continuous Market Adaptation:
Markets evolve. What worked perfectly in 2015 may require adjustment in 2025. Review your statistics quarterly, compare actual performance to backtested expectations, and consider parameter refinements if substantial deviations appear.
Alert Configuration and Automation
TrendFusion Ultimate™ Pro includes comprehensive TradingView alert functionality, essential for professional traders who can't monitor charts continuously.
Available Alert Types
Long Entry Alert: Triggers when all conditions align for a buy signal-ADX above threshold, DMI+ greater than DMI-, and rising moving average.
Short Entry Alert: Triggers for short/sell signals (only active when Trade Type is set to "Short" or "LongAndShort")-ADX above threshold, DMI- greater than DMI+, and falling moving average.
Exit Position Alert: Notifies when it's time to close long or short positions due to any confirmation component failing.
Setting Up Professional Alerts
Step 1: Create Alert
Right-click on your chart and select "Add Alert." Choose TrendFusion Ultimate™ Pro from the condition dropdown.
Step 2: Select Alert Type
Choose your desired alert: Long Entry, Short Entry, or Exit Position. Most traders set up all three alert types for comprehensive coverage.
Step 3: Configure Notifications
Select notification preferences: popup notifications for when you're at your computer, email alerts for remote monitoring, and SMS (if you have a TradingView Premium plan) for critical signals. Push notifications to the TradingView mobile app are also available.
Step 4: Set Expiration and Frequency
For ongoing monitoring, set alerts to "Once Per Bar Close" to avoid multiple notifications on the same signal. Expiration should be set to your preference-some traders prefer indefinite alerts, others renew monthly.
Webhook Integration for Automation
Advanced traders can connect TradingView alerts to webhook URLs for automated trading. Each alert sends a standardized message that can be parsed by trading bots or automation platforms like 3Commas, Cryptohopper, or custom Python/Node.js scripts.
Critical Automation Warnings:
Always test webhook integrations extensively with paper trading before deploying real capital. Automated systems can execute trades faster than you can intervene, making thorough testing essential. Include kill switches and position size limits in your automation logic. Monitor automated systems daily even if they're "set and forget."
Common Challenges and Solutions
Even well-designed systems encounter implementation challenges. Here are professional solutions to common issues.
Challenge: Insufficient Signal Generation
Symptoms: No signals appearing on chart despite clear trends, or signals appearing much later than expected.
Diagnostic Steps:
Check your ADX trend level setting-if set too high (above 30), the system may be filtering out valid trends
Verify you're using the daily timeframe where presets are optimized
Ensure the indicator is properly loaded and not showing error messages
Confirm you've selected a specific preset rather than Custom with default parameters
Solutions:
Reduce ADX trend level by 5 points (e.g., from 25 to 20) to allow earlier signal generation
Switch to a faster moving average type like ZLEMA or DEMA for more responsive signals
If using Custom settings, try loading a preset first to verify the indicator is functioning correctly
Consider that ranging markets naturally produce fewer signals-this is a feature, not a bug
Challenge: Excessive False Signals
Symptoms: Too many whipsaw trades, signals appearing in choppy markets, reduced profitability despite following all signals.
Diagnostic Steps:
Review your statistics panel's win rate and profit factor-if profit factor is below 1.2, signals may be too frequent
Check if you're using lower timeframes (4-hour, 1-hour) where noise increases
Examine whether you're using fast moving average types in volatile conditions
Solutions:
Increase ADX trend level by 5-10 points to filter weaker trends
Switch to smoother moving average types like SMA, SSMA, or TriangularMA
Increase DMI and ADX smoothing periods for more stable readings
Return to daily timeframe if using lower timeframes
Consider using longer moving average periods (40-60 instead of 30-35)
Challenge: Missing Major Trend Moves
Symptoms: System enters trends late or exits profitable trends prematurely, leaving substantial profits on the table.
Diagnostic Steps:
Compare your entry prices to trend starting points-substantial delays indicate over-filtering
Review exit points relative to trend peaks-early exits suggest overly sensitive exit logic
Check if you're using slow moving average types or excessively high ADX thresholds
Solutions:
Decrease ADX trend level to allow earlier entries (e.g., from 25 to 18)
Switch to low-lag moving average types like ZLEMA, HullMA, or ALMA
Reduce moving average period for faster trend detection
Lower DMI period for more responsive momentum readings
Accept that perfect entries and exits are impossible-the goal is capturing 60-80% of trend movements, not 100%
Challenge: Statistics Table Visibility Issues
Symptoms: Can't see statistics table, table overlaps price action, or table is too small/large for your screen.
Solutions:
Adjust table location using the 9 position options (Top/Middle/Bottom - Right/Center/Left)
Change table size from Normal to Small or Large based on your screen resolution
Modify table width setting (Dynamic/20%/30%/40%/50%) for optimal fit
Select a different color theme if visibility is the issue-try Black & White for maximum contrast
Ensure "Show Backtest Results" is enabled in indicator settings
Challenge: Chart Appears Cluttered
Symptoms: Too many visual elements making chart analysis difficult, profit lines overlapping price action.
Solutions:
Toggle off "Show Profit Lines" if you don't need trade-by-trade profit visualization
Minimize the statistics table or move it to a less prominent position
Select a cleaner color theme like Black & White or Blue Classic
Adjust TradingView's chart background color to complement your chosen theme
Use TradingView's hide/show indicator feature to temporarily remove the indicator when doing pure price analysis
Understanding System Limitations
Professional traders understand that no system is perfect. TrendFusion Ultimate™ Pro has specific characteristics and limitations that must be acknowledged.
Trend-Following Inherent Limitations
Ranging Market Underperformance: By design, trend-following systems underperform in sideways, ranging markets. The ADX filter mitigates this by suppressing signals during low-trend-strength periods, but some choppy trades are inevitable. Approximately 30-40% of trades will be losses-this is normal and expected.
Late Entry, Early Exit Nature: The multi-layered confirmation system means entries occur after trends are already established, not at exact turning points. Similarly, exits trigger when trends show signs of weakening, not at absolute peaks. This conservative approach sacrifices some profit potential for reliability.
Market Condition Dependency: Performance varies based on market conditions. Strong trending periods generate exceptional returns, while consolidation periods may produce modest losses. The key is letting the exceptional trending periods more than compensate for consolidation losses.
Backtesting vs. Live Trading Differences
Slippage and Commissions: Backtest results assume perfect execution at signal bar close prices without transaction costs. Live trading includes slippage (difference between expected and actual execution prices) and commissions that reduce returns. For liquid markets like Bitcoin and major stocks, slippage is typically minimal (0.1-0.3%), but it compounds across multiple trades.
Execution Challenges: During high volatility, market orders may execute at prices substantially different from the signal bar close. Using limit orders mitigates this but risks missing entries if price gaps through your limit.
Psychological Factors: Backtests don't account for the psychological difficulty of holding through 30% drawdowns or the temptation to override signals based on fear or greed. Human psychology is often the difference between backtested and live performance.
Historical Performance Context
The exceptional Bitcoin and cryptocurrency returns occurred during an unprecedented bull market from 2011-2025. While the system clearly has edge, future returns will reflect future market conditions, which may differ substantially from the historical testing period.
Traditional stock market returns (20-100% annually) are more representative of what systematic trend-following typically achieves across extended periods. The crypto returns represent the intersection of a superior system with extraordinary market conditions.
Your Path to Professional Systematic Trading
TrendFusion Ultimate™ Pro represents a comprehensive professional trading system, but tools alone don't create success. Your implementation determines results.
Implementation Roadmap
Phase 1: Education and Understanding (Week 1-2)
Study this complete guide thoroughly
Load the indicator and explore all presets across different markets
Experiment with different moving average types and visual themes
Review historical signals on your target markets to understand system behavior
Analyze the statistics panel to comprehend all 17 performance metrics
Phase 2: Backtesting and Optimization (Week 3-4)
Run formal backtests using TradingView's strategy tester
If customizing parameters, test modifications across at least 3 years of data
Document all parameter combinations and their results
Select your final configuration based on data, not intuition
Phase 3: Paper Trading (Month 2-3)
Execute all signals using virtual money for at least 20 trades or 1 month
Practice your execution procedures, order entry, and position sizing calculations
Maintain detailed trade logs for review
Validate that your paper trading results approximate backtested expectations
Phase 4: Live Trading with Reduced Size (Month 4-6)
Begin live trading with 25-50% of your planned position sizes
Focus on execution discipline and system adherence
Continue detailed trade journaling
Review performance monthly against backtested benchmarks
Phase 5: Full Implementation (Month 7+)
Scale to full position sizes once confidence is established
Continue systematic review and documentation
Consider expanding to multiple markets using different presets
Maintain discipline through inevitable drawdown periods
Critical Success Factors
Discipline Above All: The difference between profitable and losing systematic traders isn't the system-it's the discipline to follow it consistently. Every override, every second-guess, every "this time is different" destroys your statistical edge.
Realistic Expectations: Understand that 30%+ drawdowns are normal, 40-45% win rates are expected, and ranging periods will test your patience. Professional trading is boring most of the time-if you need excitement, try a different profession.
Proper Capitalization: Start with sufficient capital to weather drawdowns. A $5,000 account with 2% risk per trade gives you only $100 of risk per position-likely insufficient for most markets. Consider $25,000+ as a realistic starting point for serious systematic trading.
Continuous Learning: Markets evolve. Stay current with market conditions, economic developments, and system performance. Quarterly reviews should compare actual results to backtested expectations and identify any systematic deviations requiring investigation.
Take the Next Step
TrendFusion Ultimate™ Pro provides you with institutional-grade trend detection technology optimized across 10 different markets, 15 moving average types, 11 professional visual themes, and 17 comprehensive performance statistics. The system has demonstrated exceptional historical performance across both cryptocurrency and traditional markets with complete transparency and open-source code.
But the most sophisticated indicator in the world is worthless without proper implementation. Your success depends on:
Understanding the system's mechanics and limitations thoroughly
Implementing proper position sizing and risk management
Maintaining discipline through drawdown periods
Following the system consistently without emotional override
Maintaining realistic expectations despite historical performance
Get TrendFusion Ultimate™ Pro now and join thousands of traders who have transitioned from emotional gambling to systematic, professional trading. The indicator includes complete Pine Script v6 source code, full customization capabilities, and immediate access to all professional features.
The exceptional historical performance demonstrates what's possible with properly optimized trend-following systems. The comprehensive professional features provide everything you need for serious trading. The only remaining variable is your implementation.
The markets are waiting. The trends are forming. The question is: are you ready to capture them systematically?
Start your professional trading journey with TrendFusion Ultimate™ Pro
Important Disclaimers
Performance and Risk Disclosure: Trading involves substantial risk of loss and is not suitable for all investors. Past performance, whether actual or indicated by simulated historical tests of strategies, is not indicative of future results. The exceptional backtest returns shown (including the 31,355,829.65% Bitcoin return and 15,988,900.86% XRP return) are based on historical data and do not guarantee future performance. These results represent hypothetical performance and do not account for slippage, commissions, or other trading costs that would reduce returns in live trading.
High-Risk Trading Warning: Cryptocurrency trading and leveraged financial instruments carry extremely high risk due to their volatile nature. Prices can fluctuate dramatically in short periods, potentially resulting in significant losses that may exceed your initial investment. The high volatility that creates profit opportunities also creates substantial loss potential. Maximum drawdowns exceeding 30% are possible and should be expected.
No Investment Advice: This indicator is a technical analysis tool only and does not constitute investment advice, financial recommendations, or solicitation to buy or sell any financial instruments. All trading decisions should be made based on your own research, risk tolerance, and financial situation. Consult with qualified financial professionals before making investment decisions.
Software Limitations: No trading system or indicator is infallible. TrendFusion Ultimate™ Pro may produce false signals, experience periods of losses, or fail to identify profitable opportunities. Technical indicators are based on historical price data and mathematical calculations, which may not predict future market behavior accurately.
Regulatory Compliance: Trading regulations vary by jurisdiction. Ensure you comply with all applicable laws and regulations in your area. Some financial instruments or trading methods may not be available or legal in certain jurisdictions.
Use at Your Own Risk: By using TrendFusion Ultimate™ Pro, you acknowledge that you understand the risks involved in trading and that you are solely responsible for your trading decisions and any resulting profits or losses. The creators and distributors of this indicator accept no liability for any losses incurred through its use.
Sergey Buzz