MomentumMagic™ Trading System: 41M% Bitcoin Returns + Free Setup Guide
Introduction
Most MACD indicators give you one thing: a crossover. You get the signal, you take the trade, and far too often you watch it reverse immediately because the market was just chopping sideways. The signal was real — the context was wrong.
MomentumMagic™ was built to solve exactly that problem. It goes well beyond a standard MACD by layering a configurable Trend MA direction filter and an RSI momentum confirmation on top of the core signal logic — requiring all three conditions to align before any trade is flagged. The result is a cleaner, higher-confidence signal that eliminates the majority of false entries conventional MACD tools produce in choppy markets.
The indicator ships with three fully backtested presets for Bitcoin (BTCUSD), Ethereum (ETHUSD), and the NASDAQ 100 ETF (QQQ), each refined on the daily timeframe. It is completely free and runs natively on TradingView as a Pine Script v6 indicator.
Backtested over the full available price history on TradingView, MomentumMagic™ produced a 41,213,609% net profit on Bitcoin with a 60.27% win rate and a 3.00 profit factor — among the strongest risk-adjusted results you'll find from any publicly available indicator. This guide walks you through exactly how it works, how to set it up, and how to use it professionally.
How MomentumMagic™ Works
MomentumMagic™ is a sub-chart oscillator built on an enhanced MACD engine with three independent confirmation layers. Understanding how they interact is the key to using the indicator with confidence.
The Core Engine: Enhanced MACD
The foundation is a fully customizable MACD system with four independently configurable moving averages — Fast MA, Slow MA, Signal MA, and Smooth Signal MA. All four support 13 different MA types (EMA, ZLEMA, HullMA, SMA, LineReg, and more), giving you far more flexibility than a standard MACD. By default, all components use EMA, which provides the best general-purpose responsiveness.
Confirmation Layer 1: Trend MA Filter
A standalone moving average applied to closing price determines the prevailing trend direction. Longs are only considered when this MA is rising; shorts only when it is falling. This prevents you from fighting the trend with a counter-directional MACD signal — one of the most common and costly mistakes in momentum trading.
Confirmation Layer 2: RSI Momentum Filter
The RSI filter requires momentum to align with the trade direction. RSI above 50 is required for long entries, RSI below 50 for short entries. This one rule dramatically reduces entries taken into exhausted or weakening moves.
Signal Generation (Default: Signal Turn Mode)
The default and recommended mode is Signal Turn. The conditions for a confirmed long entry are:
- The MACD signal line makes a confirmed bottom — it turns upward from a downswing
- The Trend MA is rising
- RSI is above 50
All three must be true simultaneously. A short entry requires the opposite: signal line turns down, Trend MA falling, RSI below 50. Positions close when the opposite signal fires.
Optional Additional Filters (Custom Mode)
In Custom mode you can enable a Heikin Ashi trend confirmation (used in the QQQ preset) and an ADX trend strength filter for even stricter entry conditions. The QQQ preset uses Heikin Ashi to smooth out the lower-volatility equity market environment — a good example of how these optional layers can be applied selectively based on market character.
Visual Features
On the oscillator panel you'll see the MACD line (gray), signal line (silver), smooth signal line (purple), and a color-coded histogram. A gradient fill between the MACD and signal lines — green when MACD is above, fuchsia when below — makes momentum shifts immediately readable. Trade entry and exit labels appear on both the oscillator and the main price chart, and green/pink profit lines connect each entry to its exit for instant performance review.
Backtested Performance Across Markets
All results below are generated by the indicator's built-in backtest engine on TradingView using a $10,000 initial capital base. Figures are simulated, do not account for slippage or commissions, and past performance does not guarantee future results.
Bitcoin (BTCUSD) — Daily Preset
Backtest period: August 18, 2011 – May 3, 2026 (full available history, including all major bull and bear cycles).
| Metric | Result |
|---|---|
| Net Profit (%) | 41,213,609.42% |
| Net Profit ($) | $4,121,360,941.62 |
| Avg Profit / Month | 233,514.38% |
| Avg Profit / Year | 2,802,172.53% |
| Win / Loss Ratio | 60.27% |
| Profit Factor | 3.00 |
| Max Drawdown | 23.36% |
| Total Trades | 73 |
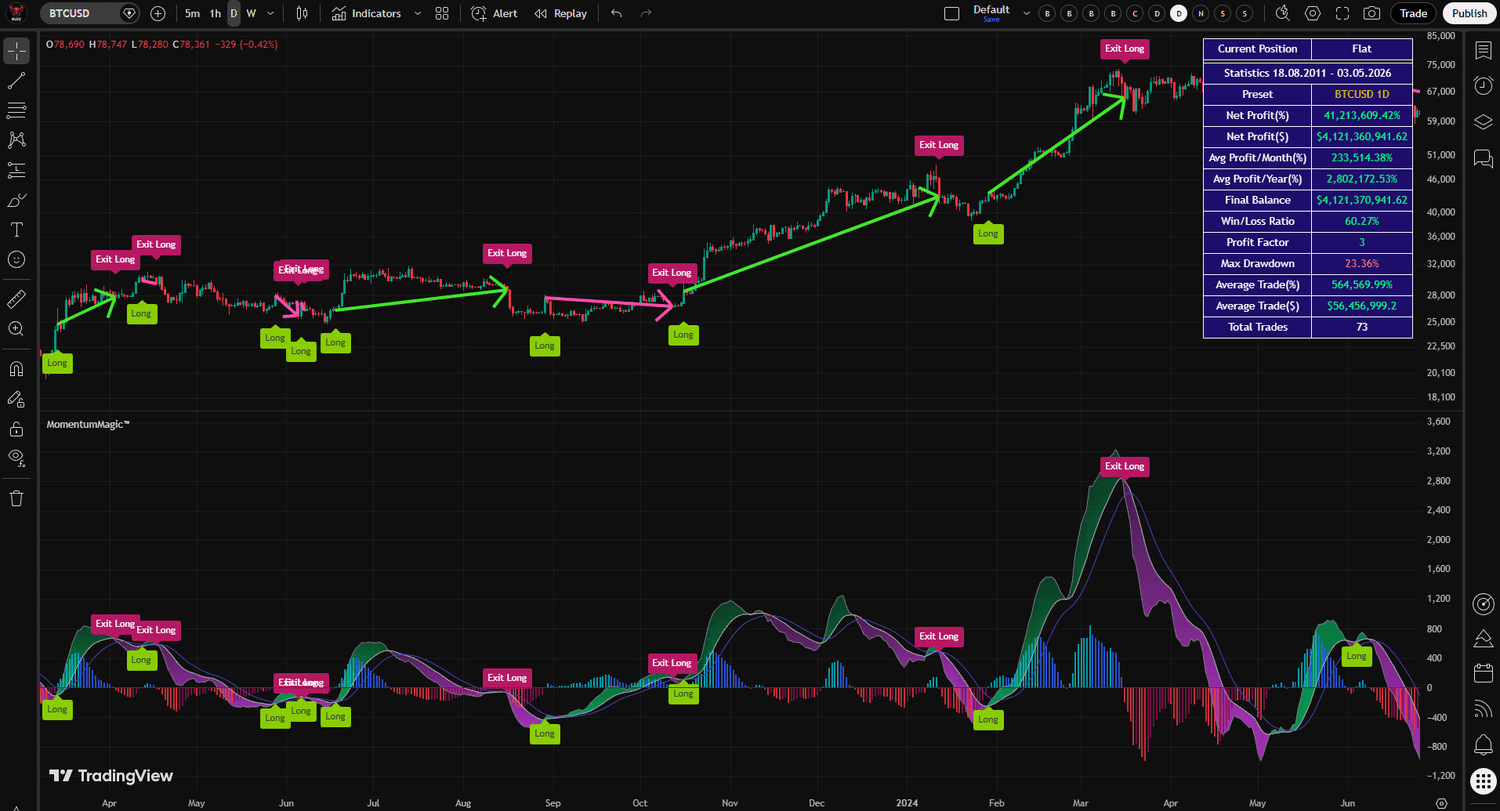
Figure 1. MomentumMagic™ on Bitcoin (BTCUSD) daily chart — 41,213,609.42% net profit over the full available history, 60.27% win rate, 3.00 profit factor, and a controlled 23.36% maximum drawdown across 73 trades.
The 60.27% win rate combined with a 3.00 profit factor is a particularly strong result. A profit factor of 3.00 means that for every dollar lost, the system generated $3.00 in profit — well above the 1.5 threshold typically considered excellent for systematic strategies. The 23.36% maximum drawdown is notably controlled given the scale of returns.
Ethereum (ETHUSD) — Daily Preset
Backtest period: August 7, 2015 – May 3, 2026 (full available history).
| Metric | Result |
|---|---|
| Net Profit (%) | 15,042,220.26% |
| Net Profit ($) | $1,504,222,025.94 |
| Avg Profit / Month | 116,738.29% |
| Avg Profit / Year | 1,400,859.50% |
| Win / Loss Ratio | 60.00% |
| Profit Factor | 2.28 |
| Max Drawdown | 31.06% |
| Total Trades | 50 |
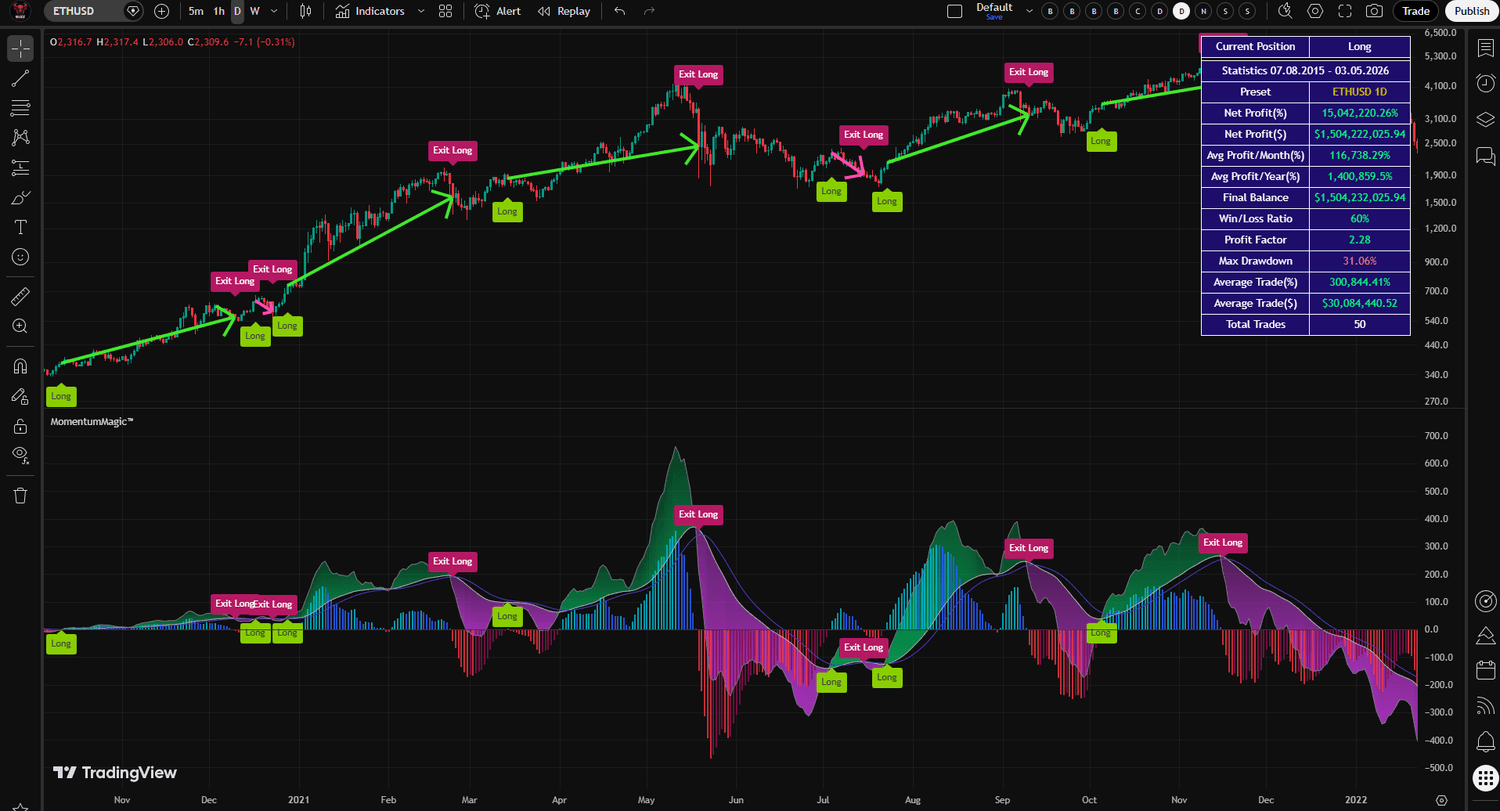
Figure 2. MomentumMagic™ on Ethereum (ETHUSD) daily chart — 15,042,220.26% net profit, 60.00% win rate, and 2.28 profit factor over the full available Ethereum history.
Ethereum's preset uses a wider slow MACD period and longer signal period to filter out Ethereum's higher-frequency noise while still capturing its major trend moves. The 2.28 profit factor and consistent 60% win rate confirm the underlying methodology translates well across different crypto assets.
QQQ (NASDAQ 100) — Daily Preset
Backtest period: March 10, 1999 – May 1, 2026 (27+ years, including the dot-com crash, 2008 financial crisis, COVID-19 correction, and 2022 bear market).
| Metric | Result |
|---|---|
| Net Profit (%) | 2,045.77% |
| Net Profit ($) | $204,577.40 |
| Avg Profit / Month | 6.28% |
| Avg Profit / Year | 75.37% |
| Win / Loss Ratio | 46.30% |
| Profit Factor | 6.73 |
| Max Drawdown | 24.74% |
| Total Trades | 54 |
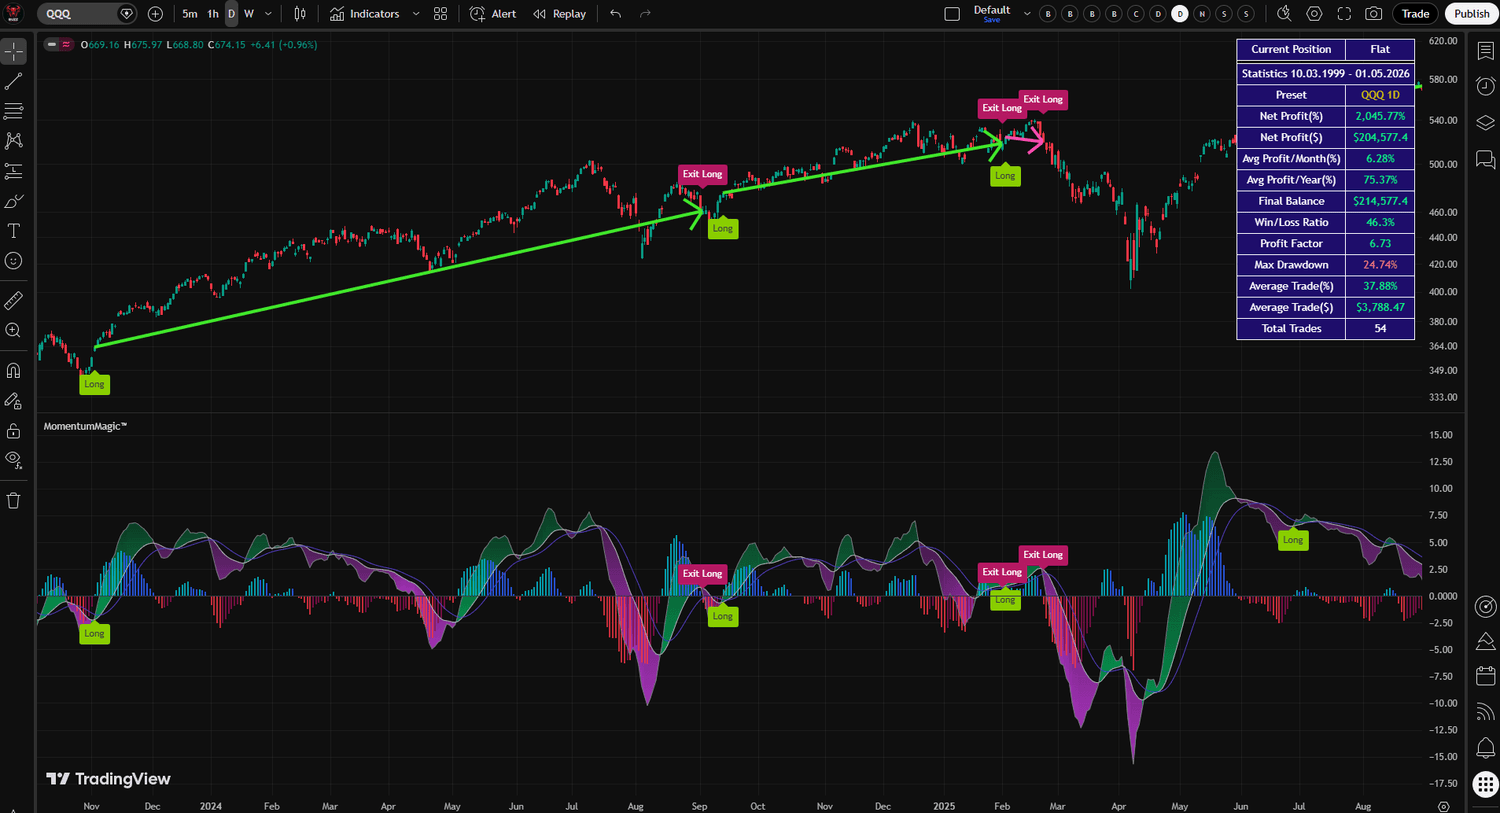
Figure 3. MomentumMagic™ on QQQ (NASDAQ 100) daily chart — 2,045.77% net profit over 27 years with an exceptional 6.73 profit factor, surviving two major market crashes.
The QQQ result is the most analytically interesting of the three. A 46.3% win rate with a 6.73 profit factor tells you something critical about the strategy's character: it doesn't need to win most trades. It wins big when it wins and loses small when it loses. Over 27 years that included two devastating crashes and a prolonged 2022 bear market, the strategy still produced 75%+ average annual returns.
The QQQ preset adds Heikin Ashi trend confirmation as a third entry filter alongside the MA trend and RSI. This additional layer suits the steadier, lower-volatility trend profile of equity ETFs versus crypto.
Setting Up MomentumMagic™
Getting MomentumMagic™ running takes under five minutes. Here's the complete setup process.
Step 1: Install the Indicator
Add MomentumMagic™ to your TradingView chart from the Indicators panel. The indicator loads on a sub-chart below the main price panel. Once loaded, it defaults to the Custom preset.
Step 2: Select Your Preset
Open the indicator settings and navigate to the "Parameters Presets" group. Choose the preset that matches your market:
- BTCUSD 1D — for Bitcoin trading on daily (use Bitstamp price feed for best results)
- ETHUSD 1D — for Ethereum trading on daily
- QQQ 1D — for NASDAQ 100 ETF trading on daily
- Custom — to build your own parameter combination
When you select a preset, all MACD, Trend MA, RSI, and entry filter parameters lock to their optimized values automatically.
Step 3: Set Your Timeframe
All three presets are calibrated for the 1D (daily) timeframe. Using them on lower timeframes will produce different signal patterns — you can experiment, but expect to re-optimize parameters if you move away from daily.
Step 4: Choose Trade Type
The Trade Type setting controls which signals the indicator generates. All presets default to Long only, appropriate for trend-following crypto and equity strategies with an upward long-term bias. Switch to LongAndShort if you want short signals, or Short only for bear market environments.
Step 5: Set Up Alerts
In TradingView's Alerts panel, create alerts for MomentumMagic Long Alert, MomentumMagic Short Alert, and MomentumMagic Close Position Alert. Set frequency to "Once Per Bar Close" to avoid duplicate notifications. Push notifications to the TradingView mobile app ensure you never miss a daily signal.
Paper Trade First
Before committing real capital, simulate trades with virtual money for a minimum of 30–60 days. This validates your execution workflow and builds genuine confidence in how the system behaves across different market conditions.
Parameter Explanation
Understanding the parameters lets you use the presets with confidence and make informed decisions when customizing. All parameters below are only editable when "Custom" is selected as the preset.
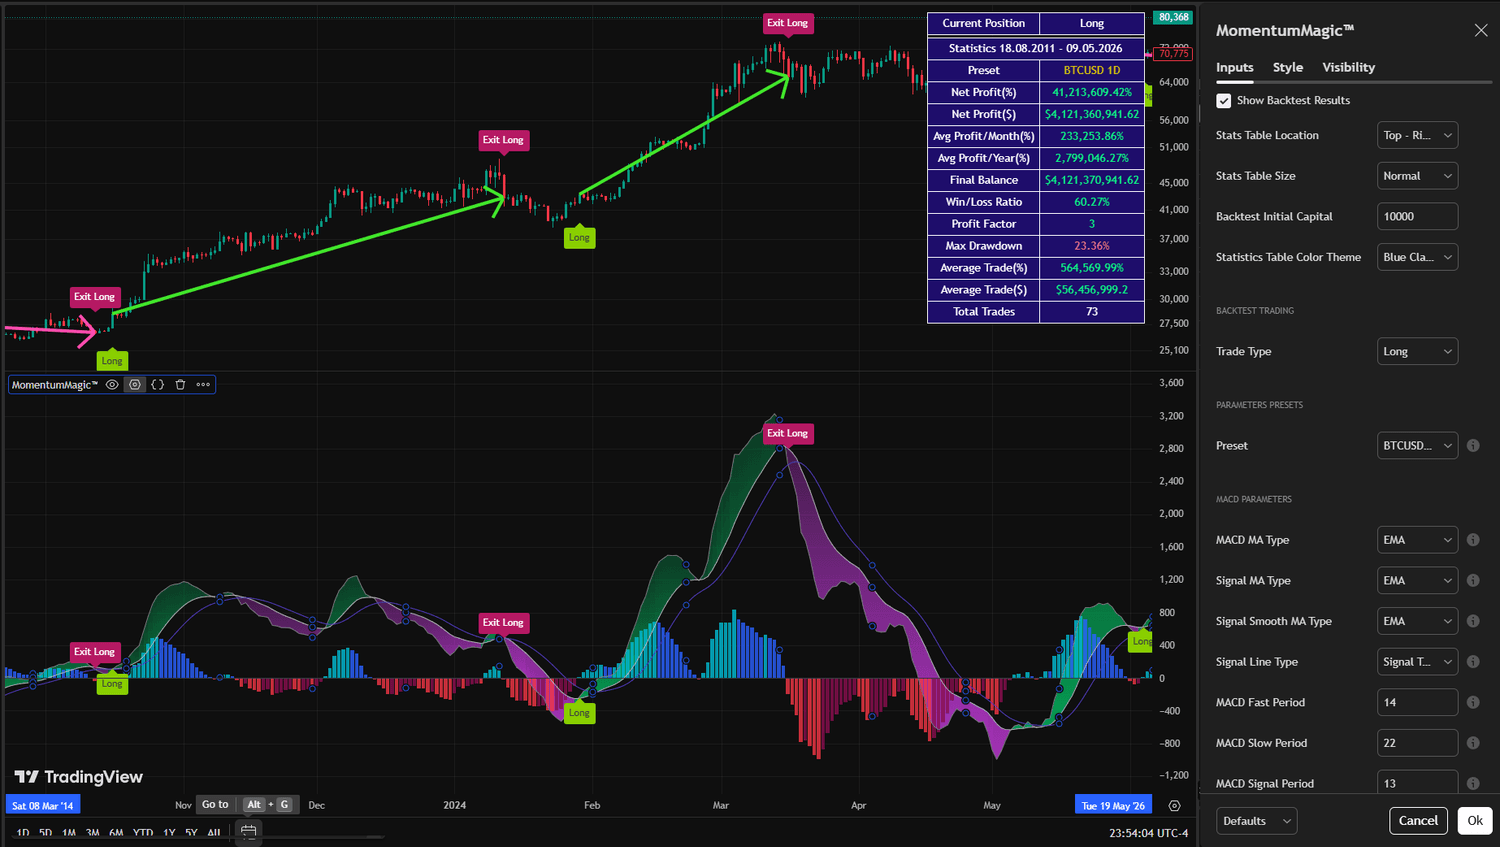
Figure 4. MomentumMagic™ settings panel showing preset selection, MACD parameters, Trend MA settings, RSI period, entry/exit filter toggles, and backtest statistics configuration.
MACD Parameters
- MACD MA Type / Signal MA Type / Signal Smooth MA Type — The MA calculation applied to each component. Supports 13 types: LineReg, ZLEMA, RMA, EMA, DEMA, TEMA, SMA, SSMA, WMA, VWMA, Tilson T3, ALMA, HullMA. EMA is the standard default across all presets.
- Signal Line Type — Determines the entry trigger. Signal Turn (default) fires when the signal line reverses direction. Other options: Signal And Smooth Line Cross, MACD Turn, Histogram.
- MACD Fast / Slow Period — Lookback periods for the two MACD components. Slow must be greater than fast. Wider gaps between fast and slow create a more smoothed MACD line.
- MACD Signal Period / Signal Smooth Period — Higher values produce smoother, less frequent signals. Lower values increase sensitivity.
Trend MA Parameters
- Trend MA Type — The MA applied to price to determine trend direction. LineReg (BTC/ETH presets) is statistically robust. RMA (QQQ preset) provides Wilder-style smoothing suited to lower-volatility markets.
- Trend MA Period — Higher periods create a slower, more stable trend filter. Lower periods respond faster but generate more false direction readings. BTC uses 19, ETH uses 30, QQQ uses 9.
RSI Parameters
- RSI Period — The lookback for the momentum filter. Shorter periods (BTC/ETH default: 6) are highly responsive to recent price action. QQQ uses 18 for a smoother reading that suits equity market cycles.
Entry & Exit Filter Parameters (Custom Mode)
- Entry On MA Trend — Requires Trend MA to be rising (longs) or falling (shorts). Enabled in all presets by default.
- Entry On RSI Trend — Requires RSI above 50 for longs, below 50 for shorts. Enabled in all presets by default.
- Entry On Heikin Ashi Trend — Adds Heikin Ashi candle direction as a third entry filter. Enabled in the QQQ preset only.
- Entry On ADX Trend — Requires a trending ADX reading above the configured threshold. Disabled in all presets by default — useful for further filtering in Custom mode.
- Exit filters — Optional triggers including MA Trend Change, MACD Signal, Heikin Ashi reversal, and Previous Low/High Breakout. By default, positions close when the opposite entry signal fires.
Backtest & Display Parameters
- Backtest Initial Capital — Starting capital for all P&L calculations. Default $10,000.
- Show Backtest Results — Toggles the statistics table on/off.
- Stats Table Location / Size — 9 position options and 4 size options for the on-chart statistics panel.
- Statistics Table Color Theme — Blue Classic, Black Diamond, or Black & White. Blue Classic is recommended for dark chart backgrounds.
Troubleshooting Common Issues
No signals appearing on the chart
Confirm your chart is on the 1D timeframe — the presets are optimized for daily and will produce very few signals on lower timeframes. Verify that a specific preset is selected (not Custom with default parameters). Check that the indicator loaded without a compile error in TradingView.
Too many false signals or whipsaw trades
In Custom mode, try enabling Entry On Heikin Ashi Trend or increasing the MACD Signal Period for a smoother signal line. You can also switch to Signal And Smooth Line Cross as the Signal Line Type for a stricter entry requirement. Using a higher-smoothing MA type like SSMA or HullMA for the Signal MA will also reduce signal frequency.
Entering trends too late or missing big moves
Decrease the Trend MA period for a faster trend filter response. Try ZLEMA or EMA as the Trend MA type instead of LineReg — both detect direction changes more quickly. Reducing the RSI period produces faster momentum readings. Alternatively, switch the Signal Line Type to MACD Turn for earlier signal generation.
Statistics table not visible
Ensure Show Backtest Results is set to true in the Backtest Statistics settings group. Adjust Stats Table Location or Size if the table is off-screen or obscured by other indicators.
Profit lines not visible on the price chart
Show Profit Lines must be enabled in the Graphics Parameters group. Profit lines are overlaid on the main price chart — check that the overlay is not hidden. Lines only appear after a trade is fully completed (both entry and exit executed).
Get MomentumMagic™ for Free
MomentumMagic™ is completely free. It includes the full Pine Script v6 source code, three professionally optimized presets, a real-time backtest statistics table, TradingView alert integration, and profit visualization lines — at no cost.
If you want to put a systematically validated momentum system to work on your charts without paying for it, this is the place to start. Paper trade the signals for 30–60 days, build your confidence in how the system behaves across different market conditions, and take it from there.
Free Pine Script v6 indicator · Works on TradingView · No credit card required
Important Disclaimers
Performance and Risk Disclosure: Trading involves substantial risk of loss and is not suitable for all investors. Past performance, whether actual or indicated by simulated historical tests, is not indicative of future results. The backtest returns shown in this guide — including the 41,213,609.42% Bitcoin figure — are based entirely on historical price data and reflect the extraordinary appreciation of early cryptocurrency markets. They are hypothetical, do not account for slippage, commissions, bid-ask spreads, or other trading costs, and are not achievable on any meaningful capital size due to liquidity constraints.
High-Risk Trading Warning: Cryptocurrency trading and financial market speculation carry extremely high risk. Prices can fluctuate dramatically in short periods, potentially resulting in losses that exceed your initial investment. The same volatility that creates exceptional backtest returns creates substantial real-world risk.
No Investment Advice: MomentumMagic™ is a technical analysis tool only. Nothing in this guide constitutes investment advice, a financial recommendation, or a solicitation to buy or sell any financial instrument. All trading decisions are solely your own responsibility. Consult a qualified financial professional before making any investment decisions.
Software Limitations: No trading system or indicator is infallible. MomentumMagic™ will produce false signals, experience losing periods, and may fail to capture certain market moves. All signals are based on historical price calculations that cannot predict future market behavior.
Use at Your Own Risk: By using MomentumMagic™, you acknowledge that you understand the risks involved in trading and that you are solely responsible for all trading decisions and any resulting profits or losses.
Sergey Buzz
sergeybuzz.com